


State Senate District 43, Nebraska
About
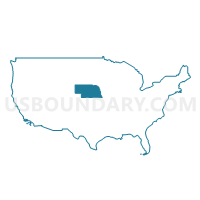
Outline

Summary
| Unique Area Identifier | 200853 |
| Name | State Senate District 43 |
| State | Nebraska |
| Area (square miles) | 16,359.35 |
| Land Area (square miles) | 16,296.34 |
| Water Area (square miles) | 63.01 |
| % of Land Area | 99.61 |
| % of Water Area | 0.39 |
| Latitude of the Internal Point | 42.17517990 |
| Longtitude of the Internal Point | -100.19926430 |
| Total Population | 31,106 |
| Total Housing Units | 17,211 |
| Total Households | 13,603 |
| Median Age | 46.8 |
Maps

Graphs
Select a template below for downloading or customizing gragh for State Senate District 43, Nebraska


Neighbors
Neighoring State Legislative District Upper Chamber (by Name) Neighboring State Legislative District Upper Chamber on the Map
- State Senate District 21, SD
- State Senate District 26, SD
- State Senate District 27, SD
- State Senate District 36, NE
- State Senate District 40, NE
- State Senate District 41, NE
- State Senate District 42, NE
- State Senate District 47, NE
- State Senate District 49, NE
Top 10 Neighboring County (by Population) Neighboring County on the Map
- Buffalo County, NE (46,102)
- Lincoln County, NE (36,288)
- Dawson County, NE (24,326)
- Custer County, NE (10,939)
- Holt County, NE (10,435)
- Todd County, SD (9,612)
- Charles Mix County, SD (9,129)
- Knox County, NE (8,701)
- Keith County, NE (8,368)
- Cherry County, NE (5,713)
Top 10 Neighboring County Subdivision (by Population) Neighboring County Subdivision on the Map
- West Todd UT, Todd County, SD (4,863)
- Broken Bow city, Custer County, NE (3,559)
- East Todd UT, Todd County, SD (2,858)
- Valentine city, Cherry County, NE (2,737)
- Sutherland precinct, Lincoln County, NE (1,745)
- Ainsworth city, Brown County, NE (1,728)
- Atkinson township, Holt County, NE (1,687)
- Hershey precinct, Lincoln County, NE (1,674)
- Hall precinct, Lincoln County, NE (1,513)
- West Bennett UT, Bennett County, SD (1,368)
Top 10 Neighboring Place (by Population) Neighboring Place on the Map
- Broken Bow city, NE (3,559)
- Valentine city, NE (2,737)
- Ainsworth city, NE (1,728)
- Atkinson city, NE (1,245)
- Bassett city, NE (619)
- Arnold village, NE (597)
- Stuart village, NE (590)
- Callaway village, NE (539)
- Sargent city, NE (525)
- Mullen village, NE (509)
Top 10 Neighboring Unified School District (by Population) Neighboring Unified School District on the Map
- Lexington Public Schools, NE (12,327)
- Todd County School District 66-1, SD (9,612)
- O'Neill Public Schools, NE (5,389)
- Cozad City Schools, NE (5,227)
- Broken Bow Public Schools, NE (4,934)
- Winner School District 59-2, SD (4,660)
- Gothenburg Public Schools, NE (4,528)
- Valentine Community Schools, NE (4,515)
- Gordon-Rushville Public Schools, NE (4,465)
- Wagner School District 11-4, SD (3,830)
Top 10 Neighboring State Legislative District Lower Chamber (by Population) Neighboring State Legislative District Lower Chamber on the Map
- State House District 27, SD (21,985)
- State House District 21, SD (21,057)
- State House District 26A, SD (11,660)
- State House District 26B, SD (9,915)
Top 10 Neighboring 111th Congressional District (by Population) Neighboring 111th Congressional District on the Map
Top 10 Neighboring Census Tract (by Population) Neighboring Census Tract on the Map
- Census Tract 9402, Todd County, SD (5,161)
- Census Tract 9401, Todd County, SD (4,451)
- Census Tract 9558, Cherry County, NE (4,287)
- Census Tract 9719, Custer County, NE (3,949)
- Census Tract 9597, Lincoln County, NE (3,669)
- Census Tract 3, Keith County, NE (3,575)
- Census Tract 9689, Buffalo County, NE (3,555)
- Census Tract 9403, Charles Mix County, SD (3,323)
- Census Tract 9598, Lincoln County, NE (3,311)
- Census Tract 9701, Sherman County, NE (3,152)
Top 10 Neighboring 5-Digit ZIP Code Tabulation Area (by Population) Neighboring 5-Digit ZIP Code Tabulation Area on the Map
- 69101, NE (29,904)
- 68850, NE (12,295)
- 69130, NE (5,307)
- 68763, NE (4,887)
- 68822, NE (4,834)
- 69138, NE (4,489)
- 57580, SD (4,449)
- 69201, NE (4,005)
- 57555, SD (3,834)
- 57380, SD (3,470)
Data
Demographic, Population, Households, and Housing Units
** Data sources from census 2010 **
Show Data on Map
Download Full List as CSV
Download Quick Sheet as CSV
| Subject | This Area | Nebraska | National |
|---|---|---|---|
| POPULATION | |||
| Total Population Map | 31,106 | 1,826,341 | 308,745,538 |
| POPULATION, HISPANIC OR LATINO ORIGIN | |||
| Not Hispanic or Latino Map | 30,677 | 1,658,936 | 258,267,944 |
| Hispanic or Latino Map | 429 | 167,405 | 50,477,594 |
| POPULATION, RACE | |||
| White alone Map | 30,085 | 1,572,838 | 223,553,265 |
| Black or African American alone Map | 52 | 82,885 | 38,929,319 |
| American Indian and Alaska Native alone Map | 402 | 18,427 | 2,932,248 |
| Asian alone Map | 70 | 32,293 | 14,674,252 |
| Native Hawaiian and Other Pacific Islander alone Map | 4 | 1,279 | 540,013 |
| Some Other Race alone Map | 159 | 79,109 | 19,107,368 |
| Two or More Races Map | 334 | 39,510 | 9,009,073 |
| POPULATION, SEX | |||
| Male Map | 15,411 | 906,296 | 151,781,326 |
| Female Map | 15,695 | 920,045 | 156,964,212 |
| POPULATION, AGE (18 YEARS) | |||
| 18 years and over Map | 24,035 | 1,367,120 | 234,564,071 |
| Under 18 years | 7,071 | 459,221 | 74,181,467 |
| POPULATION, AGE | |||
| Under 5 years | 1,779 | 131,908 | 20,201,362 |
| 5 to 9 years | 1,949 | 128,928 | 20,348,657 |
| 10 to 14 years | 1,988 | 122,706 | 20,677,194 |
| 15 to 17 years | 1,355 | 75,679 | 12,954,254 |
| 18 and 19 years | 548 | 53,251 | 9,086,089 |
| 20 years | 163 | 26,880 | 4,519,129 |
| 21 years | 189 | 25,679 | 4,354,294 |
| 22 to 24 years | 736 | 76,717 | 12,712,576 |
| 25 to 29 years | 1,361 | 129,076 | 21,101,849 |
| 30 to 34 years | 1,559 | 116,100 | 19,962,099 |
| 35 to 39 years | 1,576 | 110,361 | 20,179,642 |
| 40 to 44 years | 1,621 | 110,477 | 20,890,964 |
| 45 to 49 years | 2,333 | 128,491 | 22,708,591 |
| 50 to 54 years | 2,610 | 130,235 | 22,298,125 |
| 55 to 59 years | 2,437 | 117,686 | 19,664,805 |
| 60 and 61 years | 881 | 41,651 | 7,113,727 |
| 62 to 64 years | 1,199 | 53,839 | 9,704,197 |
| 65 and 66 years | 766 | 29,648 | 5,319,902 |
| 67 to 69 years | 1,045 | 39,186 | 7,115,361 |
| 70 to 74 years | 1,474 | 54,292 | 9,278,166 |
| 75 to 79 years | 1,298 | 46,435 | 7,317,795 |
| 80 to 84 years | 1,087 | 37,808 | 5,743,327 |
| 85 years and over | 1,152 | 39,308 | 5,493,433 |
| MEDIAN AGE BY SEX | |||
| Both sexes Map | 46.80 | 36.20 | 37.20 |
| Male Map | 45.40 | 35.00 | 35.80 |
| Female Map | 47.80 | 37.50 | 38.50 |
| HOUSEHOLDS | |||
| Total Households Map | 13,603 | 721,130 | 116,716,292 |
| HOUSEHOLDS, HOUSEHOLD TYPE | |||
| Family households: Map | 8,845 | 467,206 | 77,538,296 |
| Husband-wife family Map | 7,618 | 366,258 | 56,510,377 |
| Other family: Map | 1,227 | 100,948 | 21,027,919 |
| Male householder, no wife present Map | 436 | 30,223 | 5,777,570 |
| Female householder, no husband present Map | 791 | 70,725 | 15,250,349 |
| Nonfamily households: Map | 4,758 | 253,924 | 39,177,996 |
| Householder living alone Map | 4,318 | 206,807 | 31,204,909 |
| Householder not living alone Map | 440 | 47,117 | 7,973,087 |
| HOUSEHOLDS, HISPANIC OR LATINO ORIGIN OF HOUSEHOLDER | |||
| Not Hispanic or Latino householder: Map | 13,497 | 680,066 | 103,254,926 |
| Hispanic or Latino householder: Map | 106 | 41,064 | 13,461,366 |
| HOUSEHOLDS, RACE OF HOUSEHOLDER | |||
| Householder who is White alone | 13,313 | 647,689 | 89,754,352 |
| Householder who is Black or African American alone | 16 | 30,185 | 14,129,983 |
| Householder who is American Indian and Alaska Native alone | 131 | 5,162 | 939,707 |
| Householder who is Asian alone | 17 | 9,801 | 4,632,164 |
| Householder who is Native Hawaiian and Other Pacific Islander alone | 3 | 384 | 143,932 |
| Householder who is Some Other Race alone | 42 | 19,845 | 4,916,427 |
| Householder who is Two or More Races | 81 | 8,064 | 2,199,727 |
| HOUSEHOLDS, HOUSEHOLD TYPE BY HOUSEHOLD SIZE | |||
| Family households: Map | 8,845 | 467,206 | 77,538,296 |
| 2-person household Map | 5,047 | 213,777 | 31,882,616 |
| 3-person household Map | 1,456 | 97,236 | 17,765,829 |
| 4-person household Map | 1,295 | 85,585 | 15,214,075 |
| 5-person household Map | 680 | 43,689 | 7,411,997 |
| 6-person household Map | 266 | 17,008 | 3,026,278 |
| 7-or-more-person household Map | 101 | 9,911 | 2,237,501 |
| Nonfamily households: Map | 4,758 | 253,924 | 39,177,996 |
| 1-person household Map | 4,318 | 206,807 | 31,204,909 |
| 2-person household Map | 381 | 37,383 | 6,360,012 |
| 3-person household Map | 34 | 6,371 | 992,156 |
| 4-person household Map | 12 | 2,392 | 411,171 |
| 5-person household Map | 9 | 663 | 126,634 |
| 6-person household Map | 3 | 199 | 48,421 |
| 7-or-more-person household Map | 1 | 109 | 34,693 |
| HOUSING UNITS | |||
| Total Housing Units Map | 17,211 | 796,793 | 131,704,730 |
| HOUSING UNITS, OCCUPANCY STATUS | |||
| Occupied Map | 13,603 | 721,130 | 116,716,292 |
| Vacant Map | 3,608 | 75,663 | 14,988,438 |
| HOUSING UNITS, OCCUPIED, TENURE | |||
| Owned with a mortgage or a loan Map | 4,464 | 321,481 | 52,979,430 |
| Owned free and clear Map | 5,400 | 163,249 | 23,006,644 |
| Renter occupied Map | 3,739 | 236,400 | 40,730,218 |
| HOUSING UNITS, VACANT, VACANCY STATUS | |||
| For rent Map | 425 | 24,404 | 4,137,567 |
| Rented, not occupied Map | 31 | 1,279 | 206,825 |
| For sale only Map | 181 | 9,167 | 1,896,796 |
| Sold, not occupied Map | 119 | 2,804 | 421,032 |
| For seasonal, recreational, or occasional use Map | 996 | 13,881 | 4,649,298 |
| For migrant workers Map | 6 | 60 | 24,161 |
| Other vacant Map | 1,850 | 24,068 | 3,652,759 |
| HOUSING UNITS, OCCUPIED, AVERAGE HOUSEHOLD SIZE BY TENURE | |||
| Total: Map | 2.26 | 2.46 | 2.58 |
| Owner occupied Map | 2.29 | 2.58 | 2.65 |
| Renter occupied Map | 2.18 | 2.21 | 2.44 |
| HOUSING UNITS, OCCUPIED, TENURE BY RACE OF HOUSEHOLDER | |||
| Owner occupied: Map | 9,864 | 484,730 | 75,986,074 |
| Householder who is White alone Map | 9,748 | 454,509 | 63,446,275 |
| Householder who is Black or African American alone Map | 8 | 10,576 | 6,261,464 |
| Householder who is American Indian and Alaska Native alone Map | 44 | 1,945 | 509,588 |
| Householder who is Asian alone Map | 4 | 4,773 | 2,688,861 |
| Householder who is Native Hawaiian and Other Pacific Islander alone Map | 2 | 148 | 61,911 |
| Householder who is Some Other Race alone Map | 14 | 9,262 | 1,975,817 |
| Householder who is Two or More Races Map | 44 | 3,517 | 1,042,158 |
| Renter occupied: Map | 3,739 | 236,400 | 40,730,218 |
| Householder who is White alone Map | 3,565 | 193,180 | 26,308,077 |
| Householder who is Black or African American alone Map | 8 | 19,609 | 7,868,519 |
| Householder who is American Indian and Alaska Native alone Map | 87 | 3,217 | 430,119 |
| Householder who is Asian alone Map | 13 | 5,028 | 1,943,303 |
| Householder who is Native Hawaiian and Other Pacific Islander alone Map | 1 | 236 | 82,021 |
| Householder who is Some Other Race alone Map | 28 | 10,583 | 2,940,610 |
| Householder who is Two or More Races Map | 37 | 4,547 | 1,157,569 |
| HOUSING UNITS, OCCUPIED, TENURE BY HISPANIC OR LATINO ORIGIN OF HOUSEHOLDER | |||
| Owner occupied: Map | 9,864 | 484,730 | 75,986,074 |
| Not Hispanic or Latino householder Map | 9,820 | 464,501 | 69,617,625 |
| Hispanic or Latino householder Map | 44 | 20,229 | 6,368,449 |
| Renter occupied: Map | 3,739 | 236,400 | 40,730,218 |
| Not Hispanic or Latino householder Map | 3,677 | 215,565 | 33,637,301 |
| Hispanic or Latino householder Map | 62 | 20,835 | 7,092,917 |
| HOUSING UNITS, OCCUPIED, TENURE BY HOUSEHOLD SIZE | |||
| Owner occupied: Map | 9,864 | 484,730 | 75,986,074 |
| 1-person household Map | 2,654 | 105,218 | 16,453,569 |
| 2-person household Map | 4,462 | 190,253 | 27,618,605 |
| 3-person household Map | 1,090 | 71,909 | 12,517,563 |
| 4-person household Map | 947 | 65,970 | 10,998,793 |
| 5-person household Map | 466 | 32,518 | 5,057,765 |
| 6-person household Map | 175 | 12,200 | 1,965,796 |
| 7-or-more-person household Map | 70 | 6,662 | 1,373,983 |
| Renter occupied: Map | 3,739 | 236,400 | 40,730,218 |
| 1-person household Map | 1,664 | 101,589 | 14,751,340 |
| 2-person household Map | 966 | 60,907 | 10,624,023 |
| 3-person household Map | 400 | 31,698 | 6,240,422 |
| 4-person household Map | 360 | 22,007 | 4,626,453 |
| 5-person household Map | 223 | 11,834 | 2,480,866 |
| 6-person household Map | 94 | 5,007 | 1,108,903 |
| 7-or-more-person household Map | 32 | 3,358 | 898,211 |
Loading...